


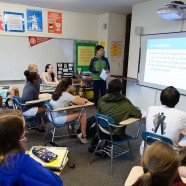
Grade 8 students are talking loudly in class. Today’s math teachers welcome that. Nancy Anderson, Milton’s K–8 math coordinator and Grade 8 math teacher, is reshaping the curriculum to optimize the value of talking.
“Discussion in class is a huge topic in math education,” says Nancy, whose doctoral degree is in math education. “The data are clear that you want to get students talking, but it’s very hard to do that well — to use students’ discussion to move the class forward.
“If we believe students learn by talking — a concept in our vision statement, and supported by research — what does that look like? How do we keep the discussion on big ideas? Not all good talk is effective talk.”
Nancy has led a renewal of the Middle School math curriculum. During year one, the faculty dove into research, wrote a vision statement that defined an effective program, and adopted new classroom materials. Last year, with coaching from Nancy, the faculty began using the new materials. Beginning in Grade 7, students take a year-and-a-half Algebra course. “This is working beautifully. Everyone tries to teach Algebra in one year, and it can’t be done,” Nancy says. The Grade 8 year concludes with a focus on probability and statistics, and the group statistics projects anchor the conversation.
 “We developed the Grade 8 group statistics project so students could use statistics to investigate and inform, rather than just analyze graphs or make graphs for the sake of creating data displays. We encourage students to choose a topic of interest to them that would also have value for all of us.”
Nancy and the other Grade 8 math teachers helped students cultivate their topic ideas and collect data sets from school and local sources, such as book fair sales, local food pantry collections, and Swap-It sales. Some students developed their own surveys to collect data on topics such as homework and sleep, recycling on campus, and time spent waiting in lunch lines.
“We wanted students to look fairly at the numbers, to have a point of view and to say with conviction why they chose to investigate a question. Why does it matter and to whom? What do the data show? What inferences can we make? What is the outcome? Our students focused on their presentation as much as their analysis, because no one collects data for the sake of collecting data. This is their chance to use data to inform us, to try to convince the audience that their point of view makes sense.”
Kat Stephan, Cianna O’Flaherty and Alana Greenaway worked together on “Comparing Concussions — Helmet vs. Non-Helmet Sports at Milton Academy.” They used PowerPoint slides, showing the data they analyzed to answer their questions: What is the number of concussions per 100 exposures, and how can we bring that number down? After their presentation, hands shot up, and students asked thoughtful, detailed and sometimes challenging questions. Concussions are a hot topic. Nancy allowed time for this discussion before asking the next group to present.
One challenge Nancy cited was helping students choose what to present and what to leave out — to make the data compelling. They also needed to learn how to clean up data so that spreadsheet functions worked. Students worked on these projects with their Google Chromebooks. Many students also used Google forms to conduct surveys.
“Watching the students analyze the data using spreadsheets and create graphs using computer applications has been wonderful. Because they are one to one with the tablets, their data were always with them, which has made the project much more fluid and engaging.”
Next year Nancy plans to have students do more data collection and run different scenarios to see how it affects results. Overall, Nancy is thrilled with the inaugural year of the statistics project. “Milton students thrive at presenting material, so it’s been great to bring that into the math classroom.”
by Liz Matson